A/B Testing: How to Choose Power, Significance Level, and MDE
A/B testing is more than just picking a winner—it’s about making the right call with data. This post breaks down power, significance level, and MDE so you can run better tests, avoid bad decisions, and get real results
DATA SCIENCESTATISTICSMACHINE LEARNING
Jake Byford
3/27/20252 min read

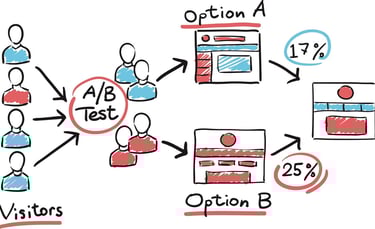
A/B testing is deceptively simple.
Change a button color. Test two versions. Pick the best one.
But here’s the thing—bad stats = bad decisions.
If you don’t set up your test correctly, you might be throwing money away on random noise.
So how do you get it right?
Let’s talk about Power, Significance Level, and Minimum Detectable Effect (MDE)—the three numbers that make or break your test.
The Core Trade-off in A/B Testing
Every A/B test is a balancing act.
You want to detect real improvements.
You don’t want to be fooled by randomness.
And you don’t want to wait forever to get results.
Here’s how these three factors interact:
Power (1 - β) → How confident you are that you won’t miss a real effect.
Significance Level (α) → How much risk you’re willing to take of a false positive.
Minimum Detectable Effect (MDE) → The smallest improvement you care about detecting.
Change one, and the others adjust automatically.
Want high confidence? You’ll need more data.
Want fast results? You’ll have to accept more uncertainty.
It’s all about trade-offs.
Choosing the Right Setup
1️⃣ High Confidence, Small Effects (Low α, High Power, Low MDE)
🔹 Use Case: Medical research, fraud detection, self-driving cars.
🔹 Setup: Significance level = 0.01, Power = 90-95%, MDE = Tiny (1-2%).
🔹 Why? If you’re wrong, bad things happen.
Imagine a hospital testing a new cancer detection algorithm.
Missing a real improvement (Type II error) means people die.
False positives (Type I error) lead to unnecessary treatments.
Even a 1% improvement is worth detecting.
🚨 Trade-off? You’ll need a massive sample size and lots of time to run the test.
2️⃣ Balanced Approach (Moderate α, Standard Power, Medium MDE)
🔹 Use Case: A/B testing ads, pricing changes, website redesigns.
🔹 Setup: Significance level = 0.05, Power = 80%, MDE = 5-10%.
🔹 Why? You need solid decisions without waiting forever.
Say you’re testing two ad versions for an e-commerce store.
You’re okay with a 5% chance of a false positive.
You want 80% confidence that you’ll detect real improvements.
You’re only looking for a 5-10% increase in conversion rates.
This is the gold standard for most business A/B tests.
It’s reliable but efficient.
🚀 Trade-off? You might miss tiny improvements, but that’s okay.
3️⃣ Fast, Cheap, and Dirty (High α, Low Power, Large MDE)
🔹 Use Case: Early-stage startup testing, small UI tweaks.
🔹 Setup: Significance level = 0.10, Power = 70-80%, MDE = 10-20%.
🔹 Why? You only care about big wins and moving fast.
Let’s say you run a small startup testing a new app feature.
You don’t have time to wait for small gains.
You only care if engagement jumps by 15% or more.
You’re okay with a higher chance of a false positive (10%) because speed matters more than precision.
🚀 Trade-off? Your results will be less reliable, but you’ll get faster insights.
How to Choose the Right Setup
Ask yourself:
Is this decision critical? → Go for high power (90-95%), low α\alphaα (0.01), small MDE.
Is this a business optimization? → Stick with 80% power, 0.05 significance level, medium MDE.
Is this an early-stage experiment? → Use lower power (70-80%), 0.10 significance level, large MDE.
Big companies chase small effects with huge sample sizes.
Startups chase big effects with small sample sizes.
Pick your battle.
Final Thought: The Formula for A/B Testing Success
🔹 Higher Power = More certainty, more data required.
🔹 Lower Significance Level = Less false positives, more time needed.
🔹 Smaller MDE = More sensitivity, but longer tests.
Get these numbers wrong?
Your A/B test might lie to you.
And the worst part?
You won’t even know it.
Choose wisely.
Best,
Jake